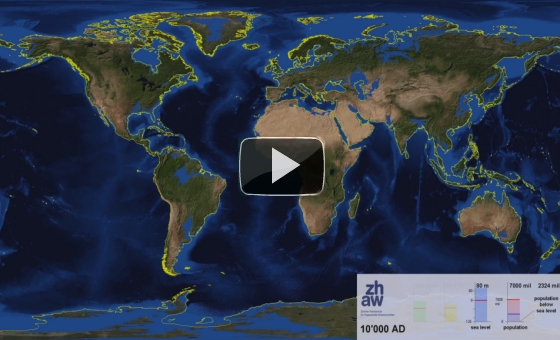
Blue Marble 10000
This visualization has been developed at the Zurich University of Applied Sciences by Adrian Meyer and Karl Rege
It shows the earth starting at the present until year 10000 in the future. End summer sea ice is shown. The yellow line shows the actual shoreline. The future projection until year 3000 is based on the assumption of complete cessation of carbon dioxide emissions in 2100 (~IPCC A2). The consecutive years are a fictional scenario of worldwide glacier meltdown, however with calculated shorelines according sea level. Because world population is rather uncertain we froze it to its current value.
For further information: eMail: info.init(at)zhaw.ch
The data sources are mainly publicly and freely available in the Internet.
|
||||||
Further information
Download
For Windows Media Player and QuickTime Player we offer also downloads:
Projektpartner
ETH Zürich |
Tokyo University |
Technorama |


